Monitoring vs Observability in 2023 - An honest take
How vague observability definitions increase complexity and costs, and how AI can help
If you're running a software system, you need to know what’s happening with it: how it’s performing, whether it’s running as expected, and whether any issues need your attention. And once you spot an issue, you need information so you can troubleshoot.
A plethora of tools promise to help with this, from monitoring, APMs, Observability, and everything in between. This has resulted in something of a turf war in the area of observability, where monitoring vendors claims they also do observability, while “observability-first” players disagree and accuse them of observability-washing.
So let's take an unbiased look at this and answer a few questions:
How are monitoring and observability different, if at all?
How effective is each at solving the underlying problem?
How does AI impact this space now and what comes next?
What is monitoring?
A monitoring solution performs 3 simple actions-
Pre-define some "metrics" in advance
Deploy agents to collect these metrics
Display these metrics in dashboards
Note that a metric here is a simple number that captures a quantifiable characteristic of a system. We can then perform mathematical operations on metrics to get different aggregate views. Monitoring has existed for the past 40 years — since the rise of computing systems — and was originally how operations teams kept track of how their infrastructure was behaving.
Types of monitoring
Originally, monitoring was most heavily used in infrastructure to keep track of infrastructure behavior - this was infrastructure monitoring. Over time, as applications became more numerous and diverse, we wanted to monitor them as well, leading to the emergence of a category called APM (Application performance monitoring). In a modern distributed system, we have several components we want to monitor — infrastructure, applications, databases, networks, data streams, and so on, and the metrics we want differ depending on the component. For instance:
Infrastructure monitoring: uptime, CPU utilization, memory utilization
Application performance monitoring: throughput, error rate, latency
Database monitoring: number of connections, query performance, cache hit ratios
Network monitoring: roundtrip time, TCP retransmits, connection churn
..and so on
These metrics are measures that are generally agreed upon as relevant for that system, and most monitoring tools come pre-built with agents that know which metric to collect, and what dashboards to display.
As the number of components in distributed systems multiplied, the volume and variety of metrics grew exponentially. To manage this complexity, a separate suite of tools and processes emerged that expanded upon traditional monitoring tools, with time-series databases, SLO systems, and new visualizations.
Distinguishing monitoring
Through all this, the core functioning of a monitoring system remains the same, and a monitoring system can be clearly distinguished if:
It captures predefined data
The data being collected is a metric (a number)
The goal of monitoring
The goal of a monitoring tool is to alert us when something unexpected is happening in a system.
This is akin to an annual medical checkup - we measure a bunch of pre-defined values that will give us an overall picture of our body and let us know if any particular sub-system (organ) is behaving unexpectedly.
And just like annual checkups, a monitoring tool may or may not provide any additional information about why something is unexpected. For that, we’ll likely need deeper, more targeted tests and investigation.
An experienced physician might still be able to diagnose a condition based on just the overall test, but that is not what the test is designed for. Same with a monitoring solution.
What is observability?
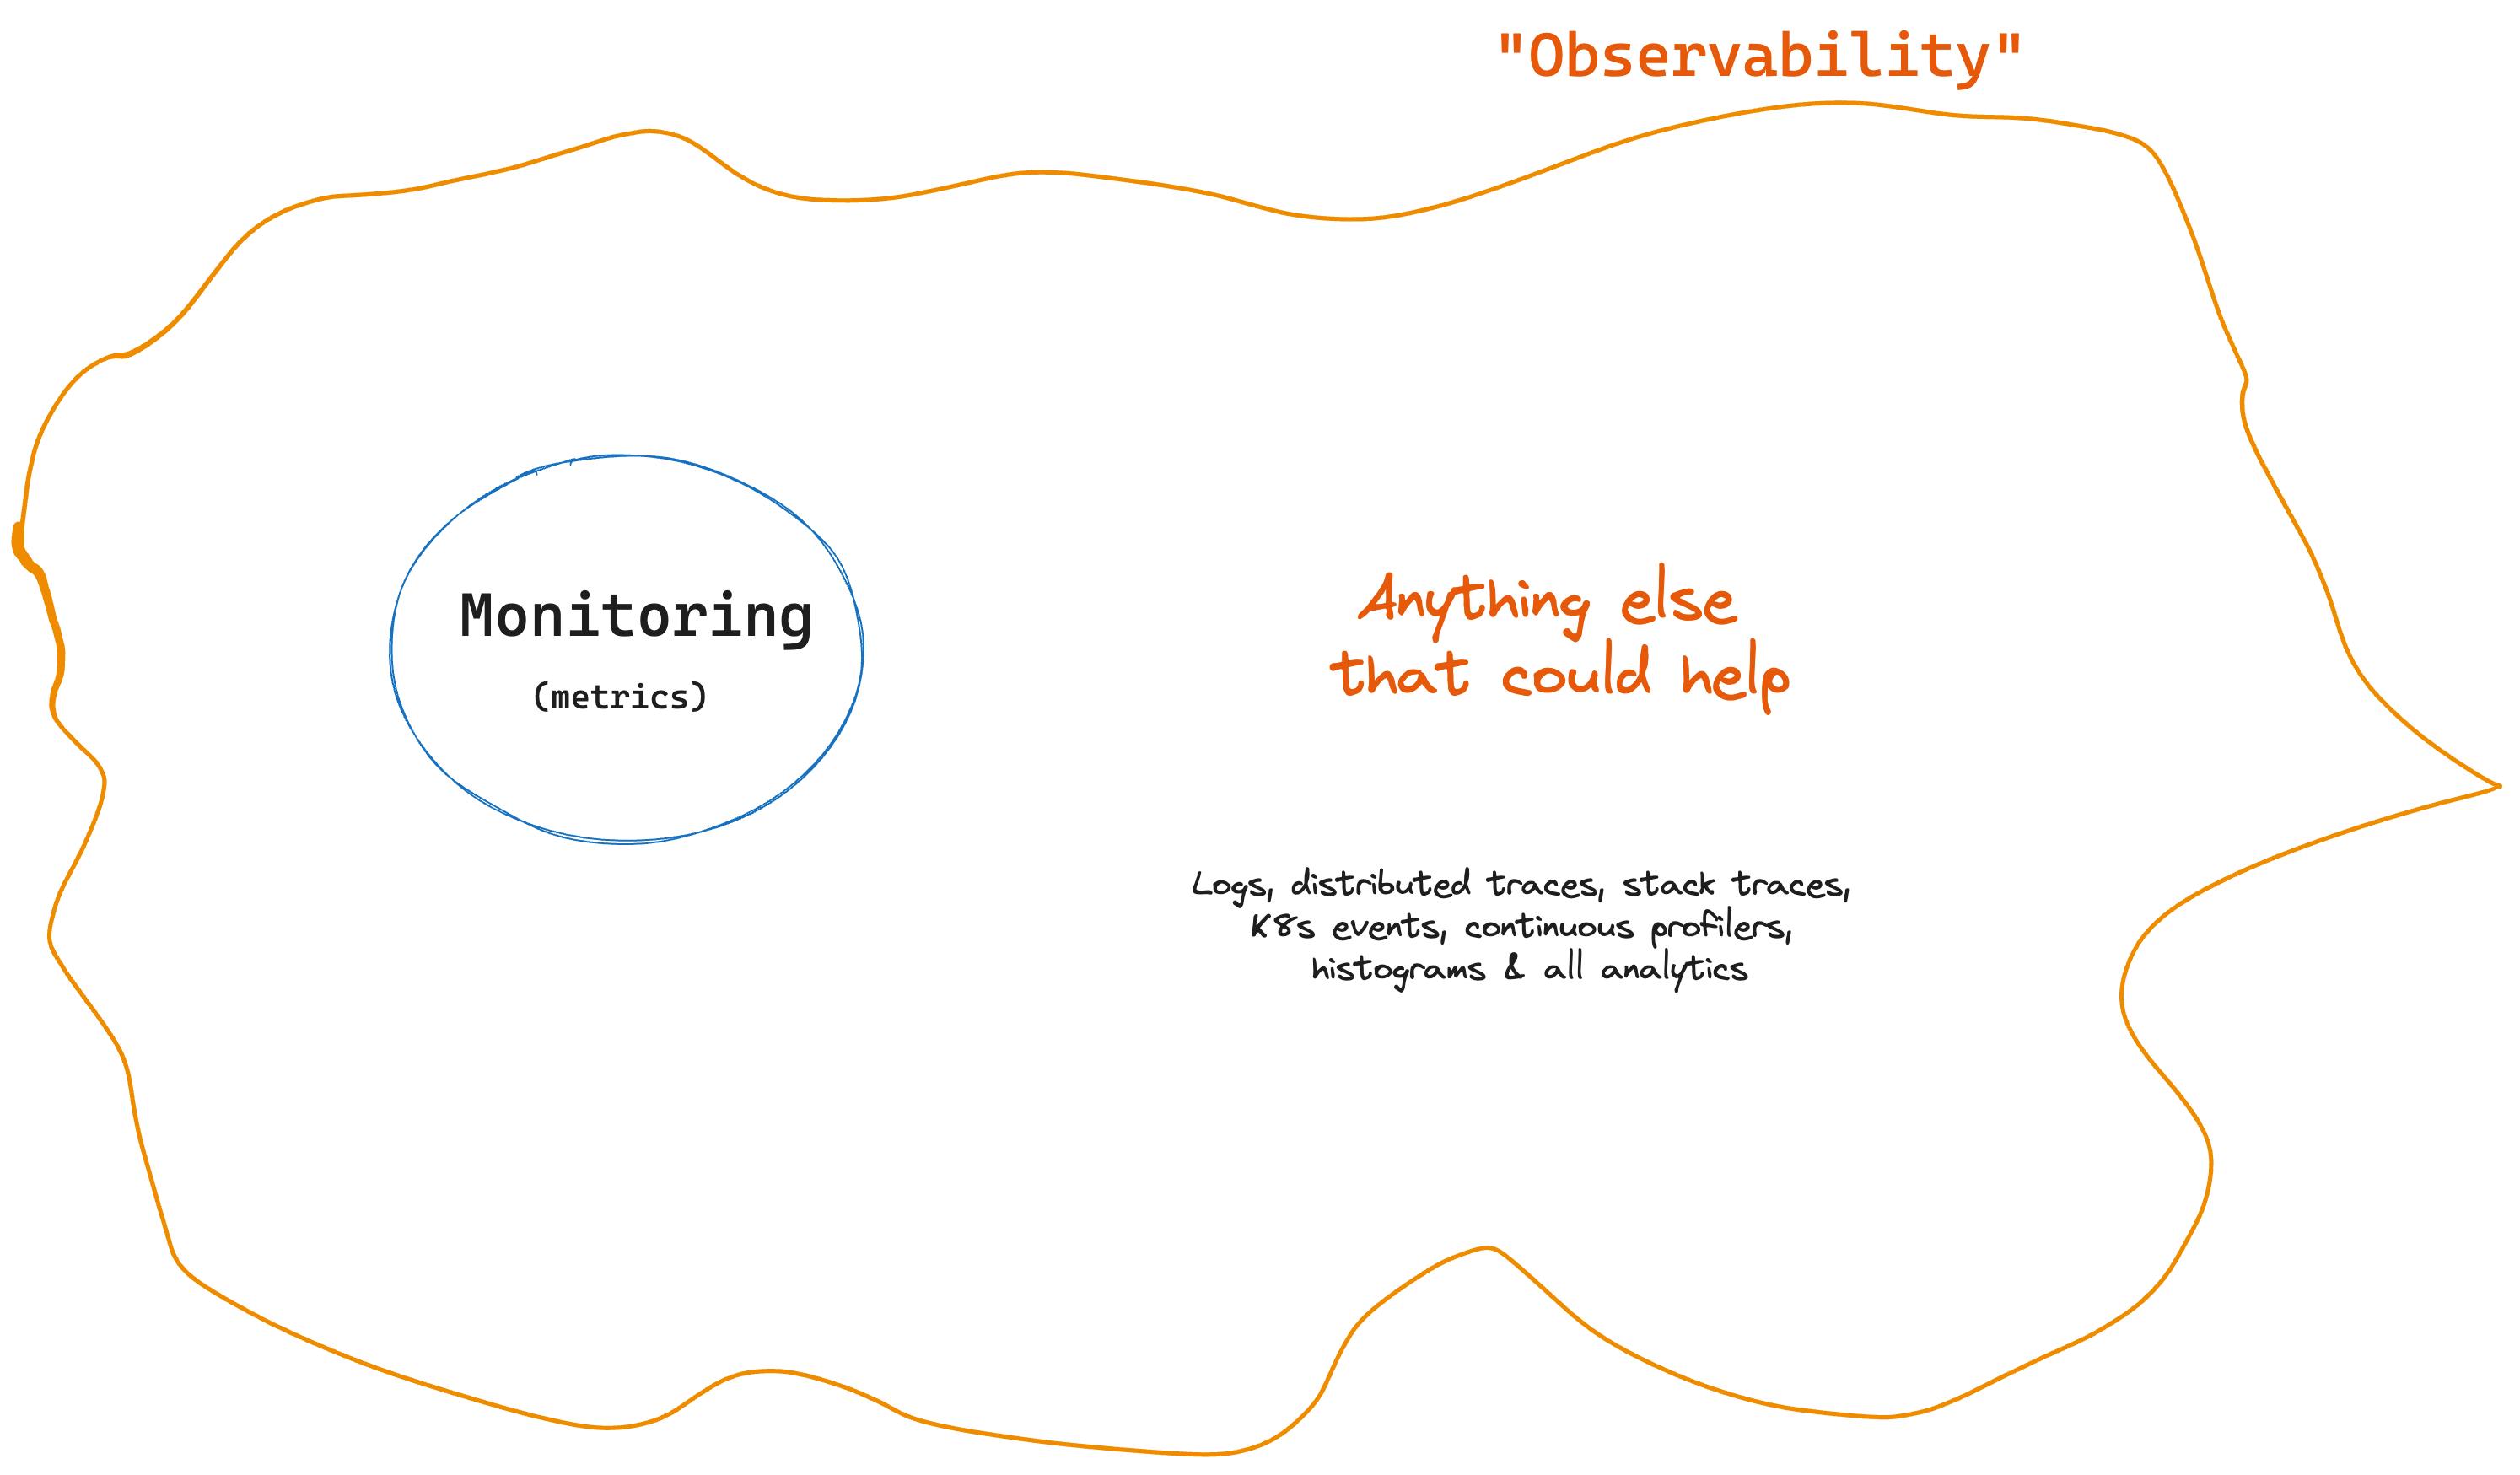
Unlike monitoring, observability is much harder to define. This is because the goal of observability is fuzzier. It is to "help us understand why something is behaving unexpectedly".
Logs are the original observability tool that we've been using since the 70s. How we worked until the late 2000s was - traditional monitoring systems would alert us when something went wrong, and logs would help us understand why. A
However, in the last 15 years, our architectures have gotten significantly more complex. It became near impossible to manually scour logs to figure out what happened. At the same time, our tolerance for downtime decreased dramatically as businesses became more digital, and we could no longer afford to spend hours understanding and fixing issues.
We needed more data than we had, so we could troubleshoot issues faster. This led to the rise of the observability industry, whose purpose was to help us understand more easily why our systems were misbehaving. This started with the addition of a new data type called traces, and we said the 3 pillars of observability were metrics, logs, and traces. Then from there, we kept adding new data types to " improve our observability".
The problem with observability
The fundamental problem with observability is - we don't know what information we might need beforehand. The data we need depends on the issue. The nature of production errors is that they are unexpected and long-tail: if they could've been foreseen, they’d have been fixed already.
This is what makes observability fuzzy: there’s no clear scope around what and how much to capture. So observability became "any data that could potentially help us understand what is happening".
Today, the best way to describe observability as it is implemented is - "Everything outside of metrics, plus metrics."

A perfectly observable system would record everything that happens in production, with no data gaps. Thankfully, that is impractical and prohibitively expensive, and 99% of the data would be irrelevant anyway, so an average observability platform needs to make complex choices on what and how much telemetry data to capture. Different vendors view this differently, and depending on who you ask, observability seems slightly different.
Commonly cited descriptions of observability are unhelpful
Common articulations of observability, like "observability is being able to observe internal states of a system through its external outputs", are vague and give us neither a clear indication of what it is, nor guide us in deciding whether we have sufficient observability for our needs.
In addition, most of the commonly cited markers that purport to distinguish observability from monitoring are also vague, if not outright misleading. Let’s look at a few examples:
1. "Monitoring is predefined data; observability is not"
In reality, nearly everything we capture in an observability solution today is also predetermined. We define in advance what logs we want to capture, what distributed traces we want to capture (including sampling mechanisms), what context to attach to each distributed trace, and when to capture a stack trace.
We're yet to enter the era of tools that selectively capture data based on what is actually happening in production.
2. "Monitoring is simple dashboards; observability is more complex analysis and correlation"
This is another promise that’s still unmet in practice.
Most observability platforms today also just have dashboards — just that their dashboards show more data than metrics (for example, strings for logs) or can pull up different charts and views based on user instructions. We don't yet have tools that can do any meaningful correlation context by themselves to help us understand problems faster.
Being able to connect a log and a trace using a unique ID doesn’t qualify as a complex analysis or correlation, even though the effort required for it may be non-trivial.
3. "Monitoring is reactive; observability is proactive"
All observability data we collect is pre-defined and nearly everything we do in production today (including around observability) is reactive. The proactive part was what we did while testing. In production, if something breaks and/or looks unexpected, we respond and investigate.
At best, we use SLO systems which could potentially qualify as proactive. With SLO systems we predefine an acceptable amount of errors (error budgets) and take action before we surpass them. However SLO systems are more tightly coupled with monitoring tools, so this is not a particularly relevant distinction between a monitoring and observability solution.
4. "Monitoring focuses on individual components; observability reveals relationships across components"
This is a distinction created just to make observability synonymous with distributed tracing. Distributed tracing is just one more data type that shows us the relationships across components. Today, distributed tracing needs to be used in conjunction with other data to be really useful (for more on this, read this article that explores the real utility of distributed tracing).
In summary, we have a poorly defined category with no outer boundaries. Then we made up several vague, not very helpful markers to distinguish that category from monitoring, which existed before. This narrative is designed to tell us that there's always some distance to go before we get to "true observability" —and always one more tool to buy. As a result, we’re continuously expanding the scope of what we need within observability.
What is the impact of this?
Ever increasing list of data types for observability
All telemetry data is observability because it helps us "observe" the states of our system. Do logs qualify as observability? Yes, because they help us understand what happened in production. Does distributed tracing qualify? Yes. How about error monitoring systems that capture stack traces for exceptions? Yes. How about live debugging systems? Yes. How about continuous profilers? Yes. How about metrics? Also yes, because they also help us understand the state of our systems.
Ever increasing volume of observability data
How much data to capture is left to the customer to decide, especially outside of monitoring. How much you want to log, how many distributed traces you want to capture, how many events you want to capture and store, at what intervals, for how long — everything is an open question, with limited guidance on how much is "reasonable" and at what point you might be capturing too much. Companies can spend $1M or as much as $65M on observability; it all depends on who builds what business case.
Tool sprawl and spending increase
All of the above has led to the amount spent on observability rising rapidly. Most companies today use five or more observability tools, and monitoring & observability is typically the second-largest infrastructure spend in a company after cloud infrastructure itself, with a market size of ~$17B.
Fear and loss-aversion are underlying drivers for observability expansion
The underlying human driver for the adoption of all these tools is fear -"What if something breaks and I don't have enough data to be able to troubleshoot"? This is every engineering team's worst nightmare. This naturally drives teams to capture more and more telemetry data every year so they feel more secure.
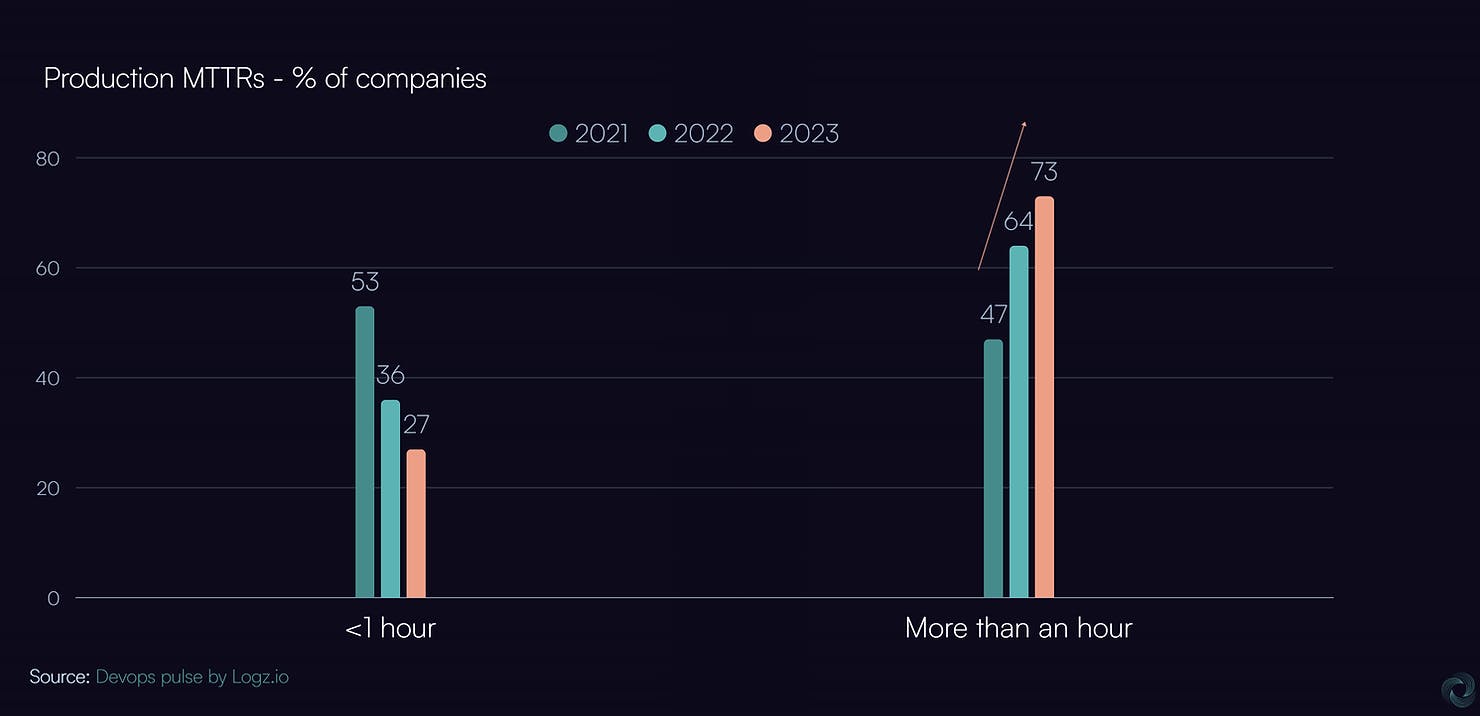
Yet MTTR appears to be increasing globally
One would expect that with the wide adoption of observability and the aggressive capturing and storing of various types of observability data, MTTR would have dropped dramatically globally.
On the contrary, it appears to be increasing, with 73% of companies taking more than an hour to resolve production issues (vs 47% just 2 years ago).
Despite all the investment, we seem to be making incremental progress at best.

Where we are now
So far, we continued to collect more and more telemetry data in the hope that processing and storage costs would keep dropping to support that. But with exploding data volumes, we ran into a new problem outside of cost, which is usability. It was getting impossible for a human to directly look at 10s of dashboards and arrive at conclusions quickly enough. So we created different data views and cuts to make it easier for users to test and validate their hypotheses. But these tools have become too complex for an average engineer to use, and we need specially trained "power users" (akin to data scientists) who are well versed in navigating this pool of data to identify an error.
This is the approach many observability companies are taking today: capture more data, have more analytics, and train power users who are capable of using these tools. But these specialized engineers do not have enough information about all the parts of the system to be able to generate good-enough hypotheses.
Meanwhile, the average engineer continues to rely largely on logs to debug software issues, and we make no meaningful improvement in MTTR. So all of observability seems like a high-effort, high-spend activity that allows us merely to stay in the same place as our architectures rapidly grow in complexity.
So what’s next?
Inferencing - the next stage after Observability?
To truly understand what the next generation would look like, let us start with the underlying goal of all these tools. It is to keep production systems healthy and running as expected and, if anything goes wrong, to allow us to quickly understand why and resolve the issue.
If we start there, we can see that are three distinct levels in how tools can support us:
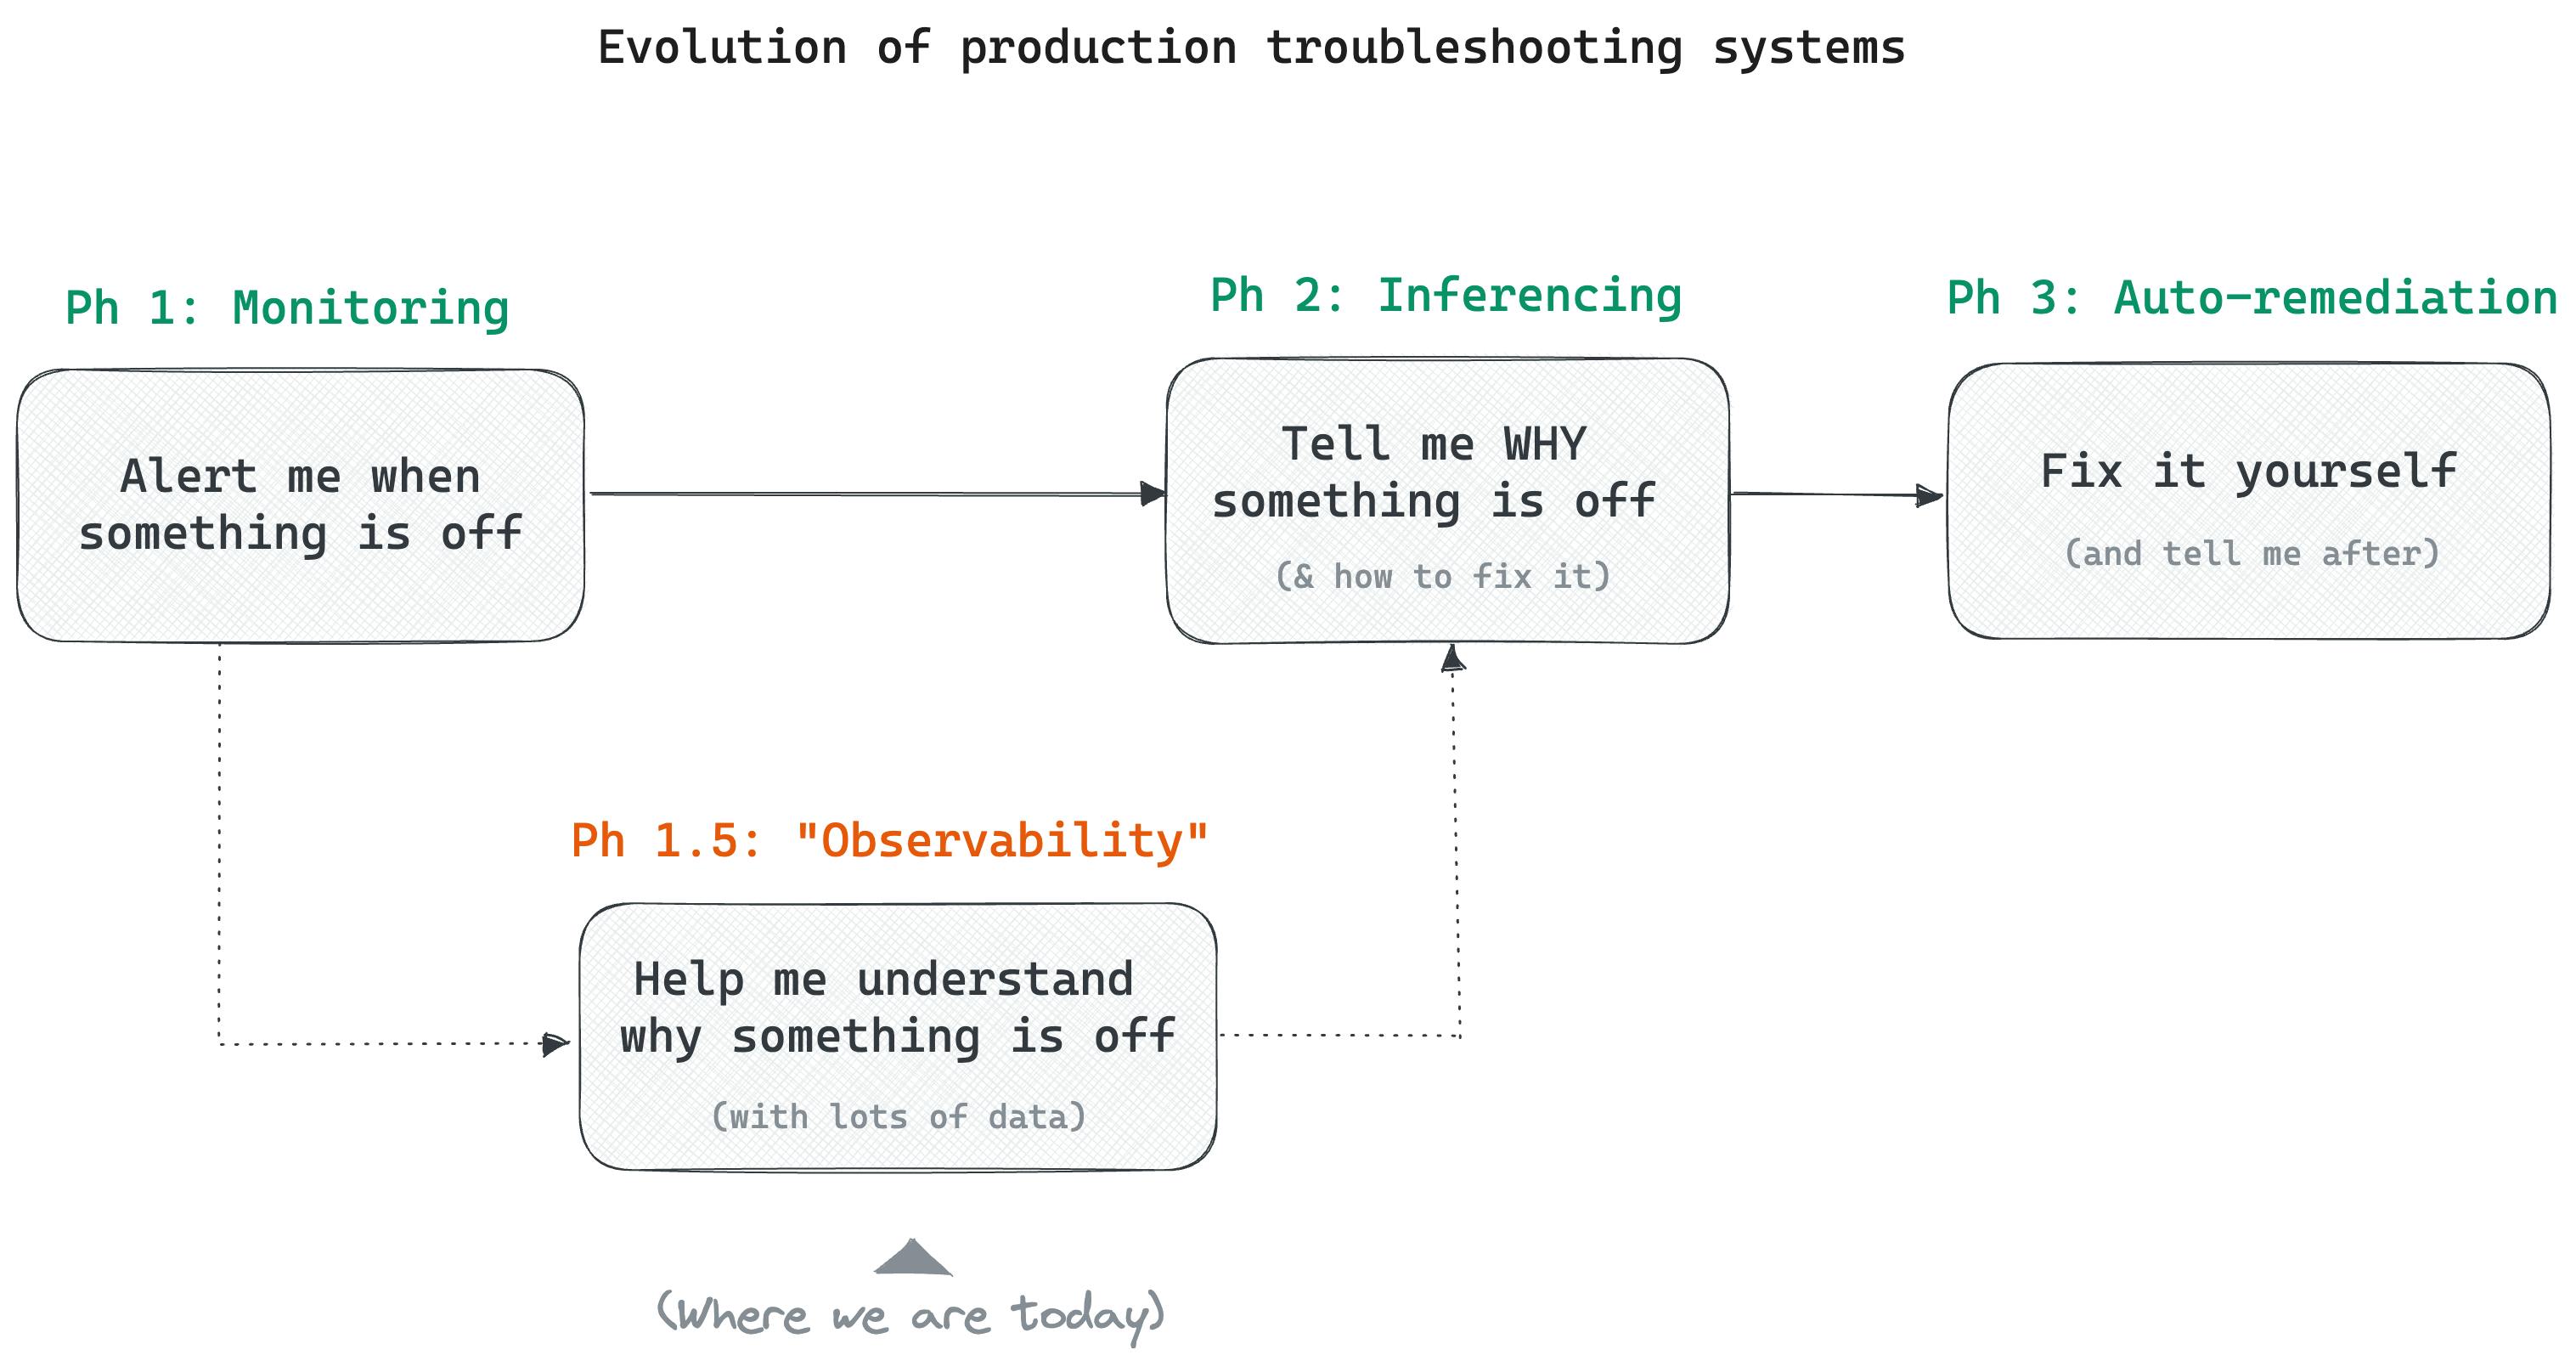
Level 1: "Tell me when something is off in my system" — monitoring
Level 2: "Tell me why something is off (and how to fix it)" — let's call this inferencing
Level 3: "Fix it yourself and tell me what you did" — auto-remediation
Traditional monitoring tools do Level 1 reasonably well and help us detect issues. We have not yet reached Level 2 where a system can automatically tell us why something is breaking.
So we introduced a set of tools called observability that sit somewhere between Level 1 and Level 2, to "help understand why something is breaking” by giving us more data.

Inferencing — Observability plus AI
I'd argue the next step after observability is Inferencing — where a platform can reasonably explain why an error occurred, so we can fix it. This becomes possible now in 2023 with the rapid evolution of AI models over the last few months.
Imagine a solution that:
Automatically surfaces just the errors that need immediate developer attention.
Tells the developer exactly what is causing the issue and where the issue is: this pod, this server, this code path, this line of code, for this type of request.
Guides the developer on how to fix it.
Uses the developer's actual actions to improve its recommendations continuously.
There is some early activity in this space, including with companies like ZeroK, but this is an open space as yet and we can expect several new companies to emerge here over the next couple of years.
Avoiding the pitfalls of AIOps
In any conversation around AI + observability, it’s important to remember that this has been attempted before with AIOps, with limited success. To understand why, read -AIOps Is Dead.
It will be important for inferencing solutions to avoid the pitfalls of AIOps. To do that, inferencing solutions would have to be architected ground-up for the AI use-case i.e., data collection, processing, storage, and user interface are all designed ground-up for root-causing issues using AI.
What it will probably NOT look like, is AI added on top of existing observability tools and existing observability data, simply because that is what we attempted and failed with AIOPs.
See here for a more detailed exploration of what AI-based Inferencing solutions will look like: https://www.zerok.ai/post/inferencing-the-ai-led-future-of-observability
Conclusion
We explored monitoring and observability and how they differ. We looked at how observability is poorly defined today with loose boundaries, which results in uncontrolled data, tool, and spend sprawl. Meanwhile, the latest progress in AI could resolve some of the issues we have with observability today with a new class of Inferencing solutions based on AI. Watch this space for more on this topic!

