


Table of contents
- What is Distributed Tracing?
- Components of a distributed tracing system
- Implementing distributed tracing systems is complex
- Best practices for Distributed Tracing
- 1. Pick OTel for instrumentation
- 2. Leverage automatic instrumentation where possible
- 3. Start with critical paths and expand from there
- 4. Be intentional about sampling
- 5. Be selective in implementing custom tracing
- 6. Integrate tracing with your monitoring and logging systems
- 6. Pick a modern trace visualization front-end
- 7. Explore next-generation tools that combine AI and tracing
- 8. Invest in developer onboarding!
- Conclusion
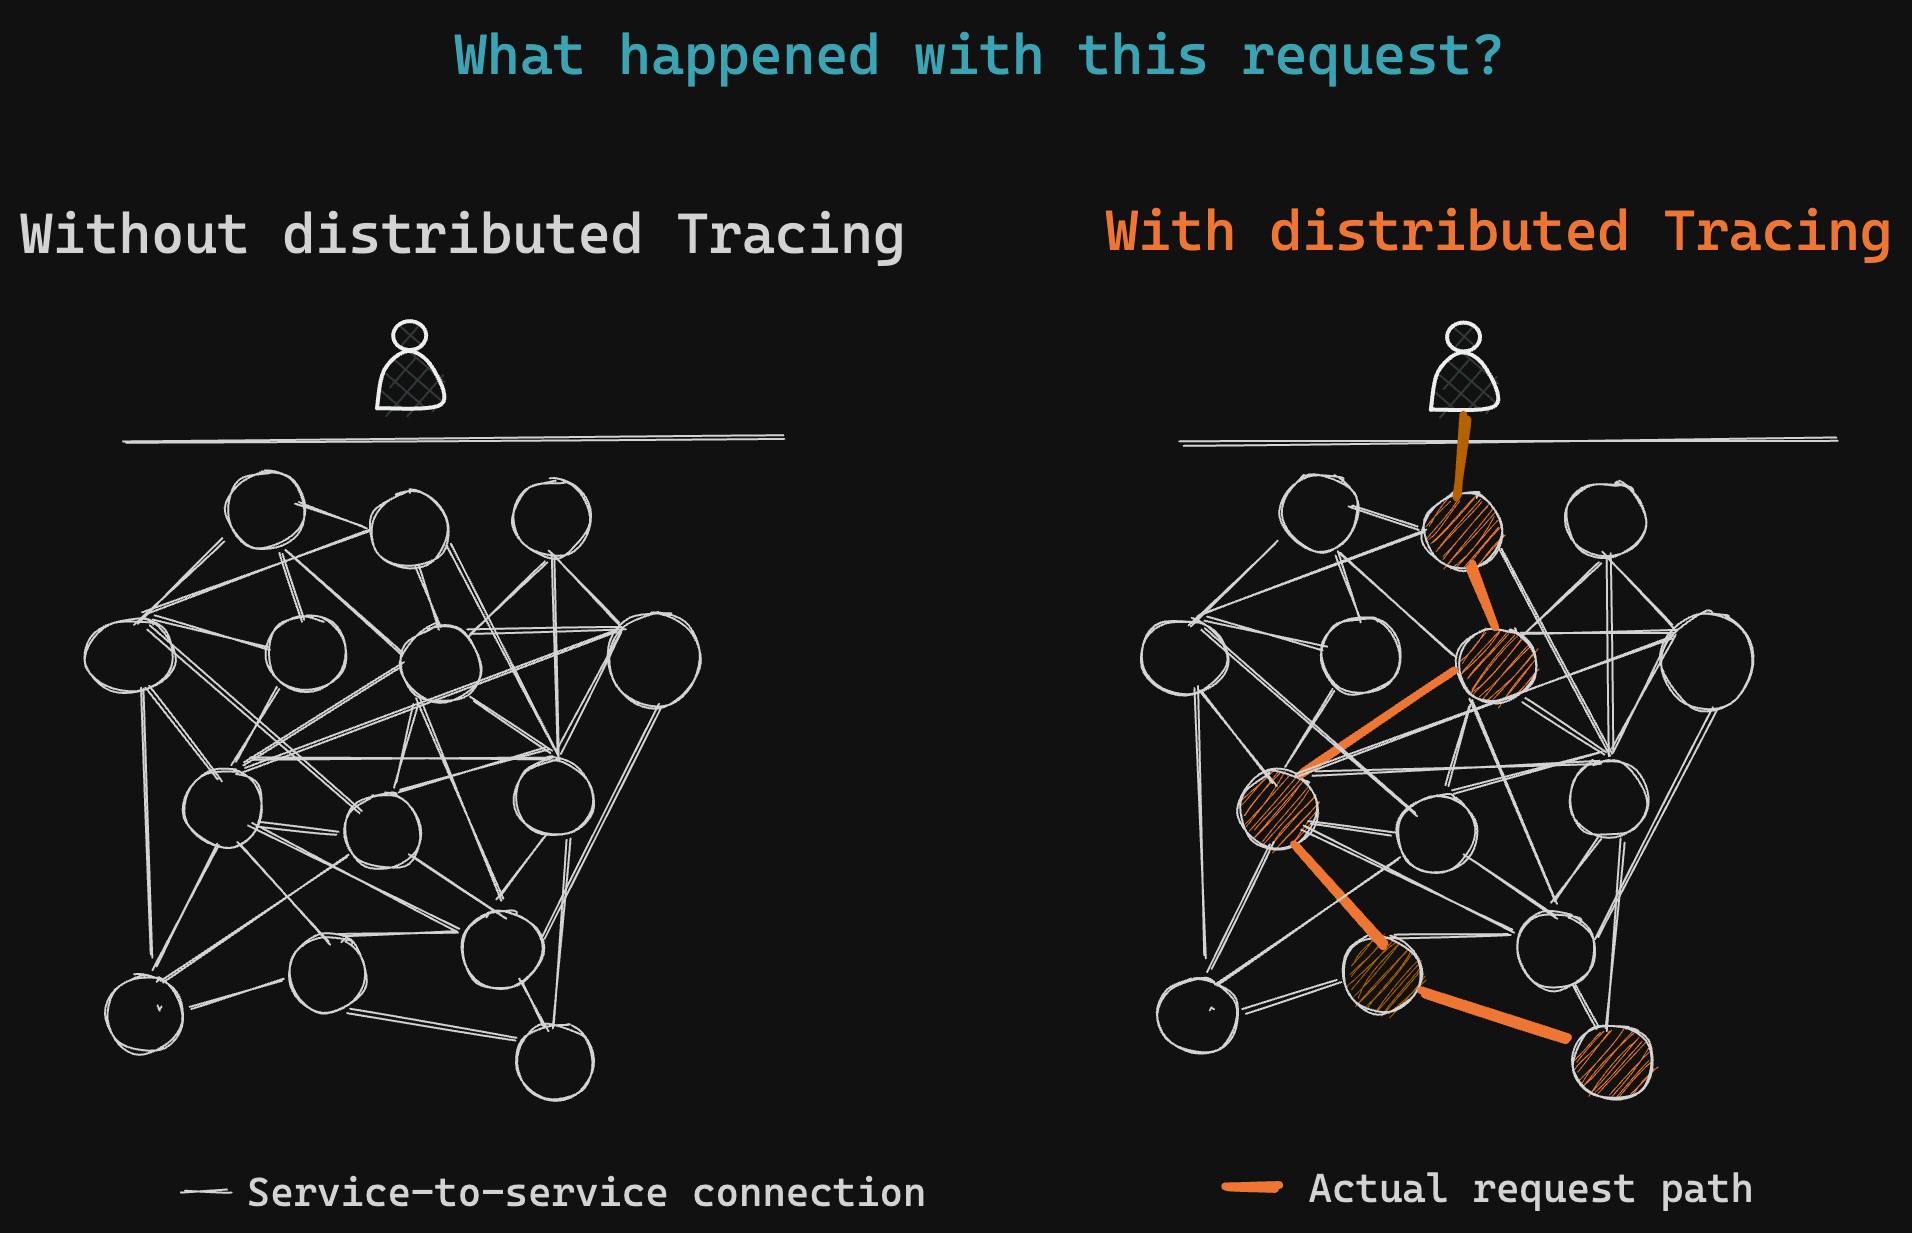
Distributed tracing is now a staple in the modern observability stack. With the shift to microservices, we needed a new way to observe how our services interacted. Distributed Tracing provides that view by allowing us to do request tracing - i.e., trace a request across the components in our distributed system. Today Distributed Tracing is used for identifying performance bottlenecks, debugging issues, and understanding how our systems are interacting in production.

However, implementing Distributed Tracing is complex, and how much value teams get from it depends a fair bit on how it is implemented. Implementation mechanics like which components are instrumented, the sampling rate, quality of trace visualization - all influence the value companies get from tracing, which in turn influences developer adoption. Additionally, this space is continuously evolving, with new tools and techniques emerging all the time.
In this article, let us look at best practices for distributed tracing in 2023.
What is Distributed Tracing?
Distributed Tracing refers to a mechanism that allows us to track a single request as it traverses multiple services in a distributed environment.
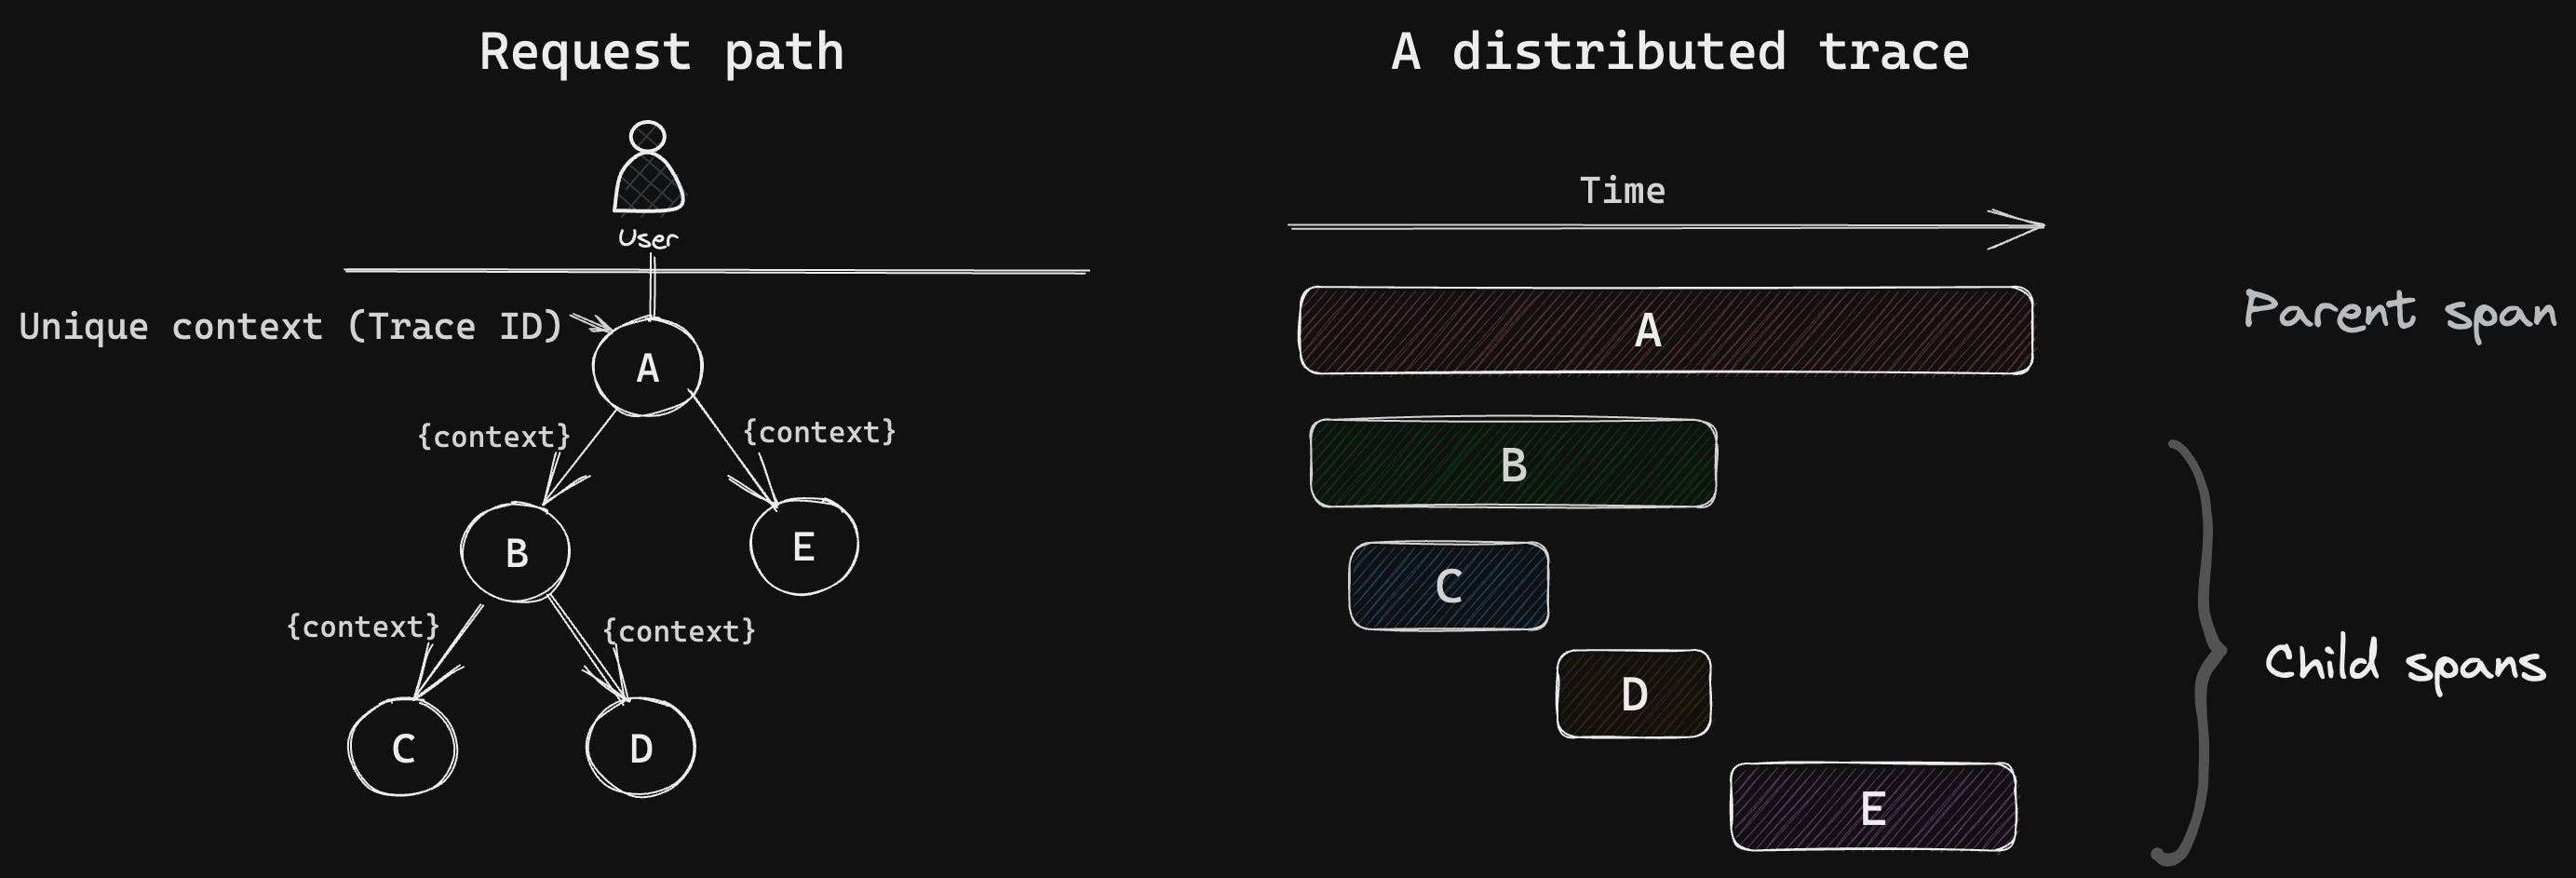
To enable this, distributed tracing tools insert a unique trace context (trace ID) into each request's header and implement mechanisms to ensure that the trace context is propagated throughout the request path.
Each network call made in the request's path is captured and represented as a span. A span is a basic unit of a trace - it represents a single event within the trace, and a trace can have one or multiple spans. A span consists of log messages, time-related data, and other attributes to provide information about the operation it tracks.
Through its unique view, Distributed Tracing unlocks several new use-cases/ improves existing use cases. It allows us to understand service interdependencies (for e.g., who is calling my service), identify performance bottlenecks (which specific DB call is degrading my latency?), quickly identify failure points for debugging (which API is causing this 500 issue?) and also have more granular SLOs.
Components of a distributed tracing system
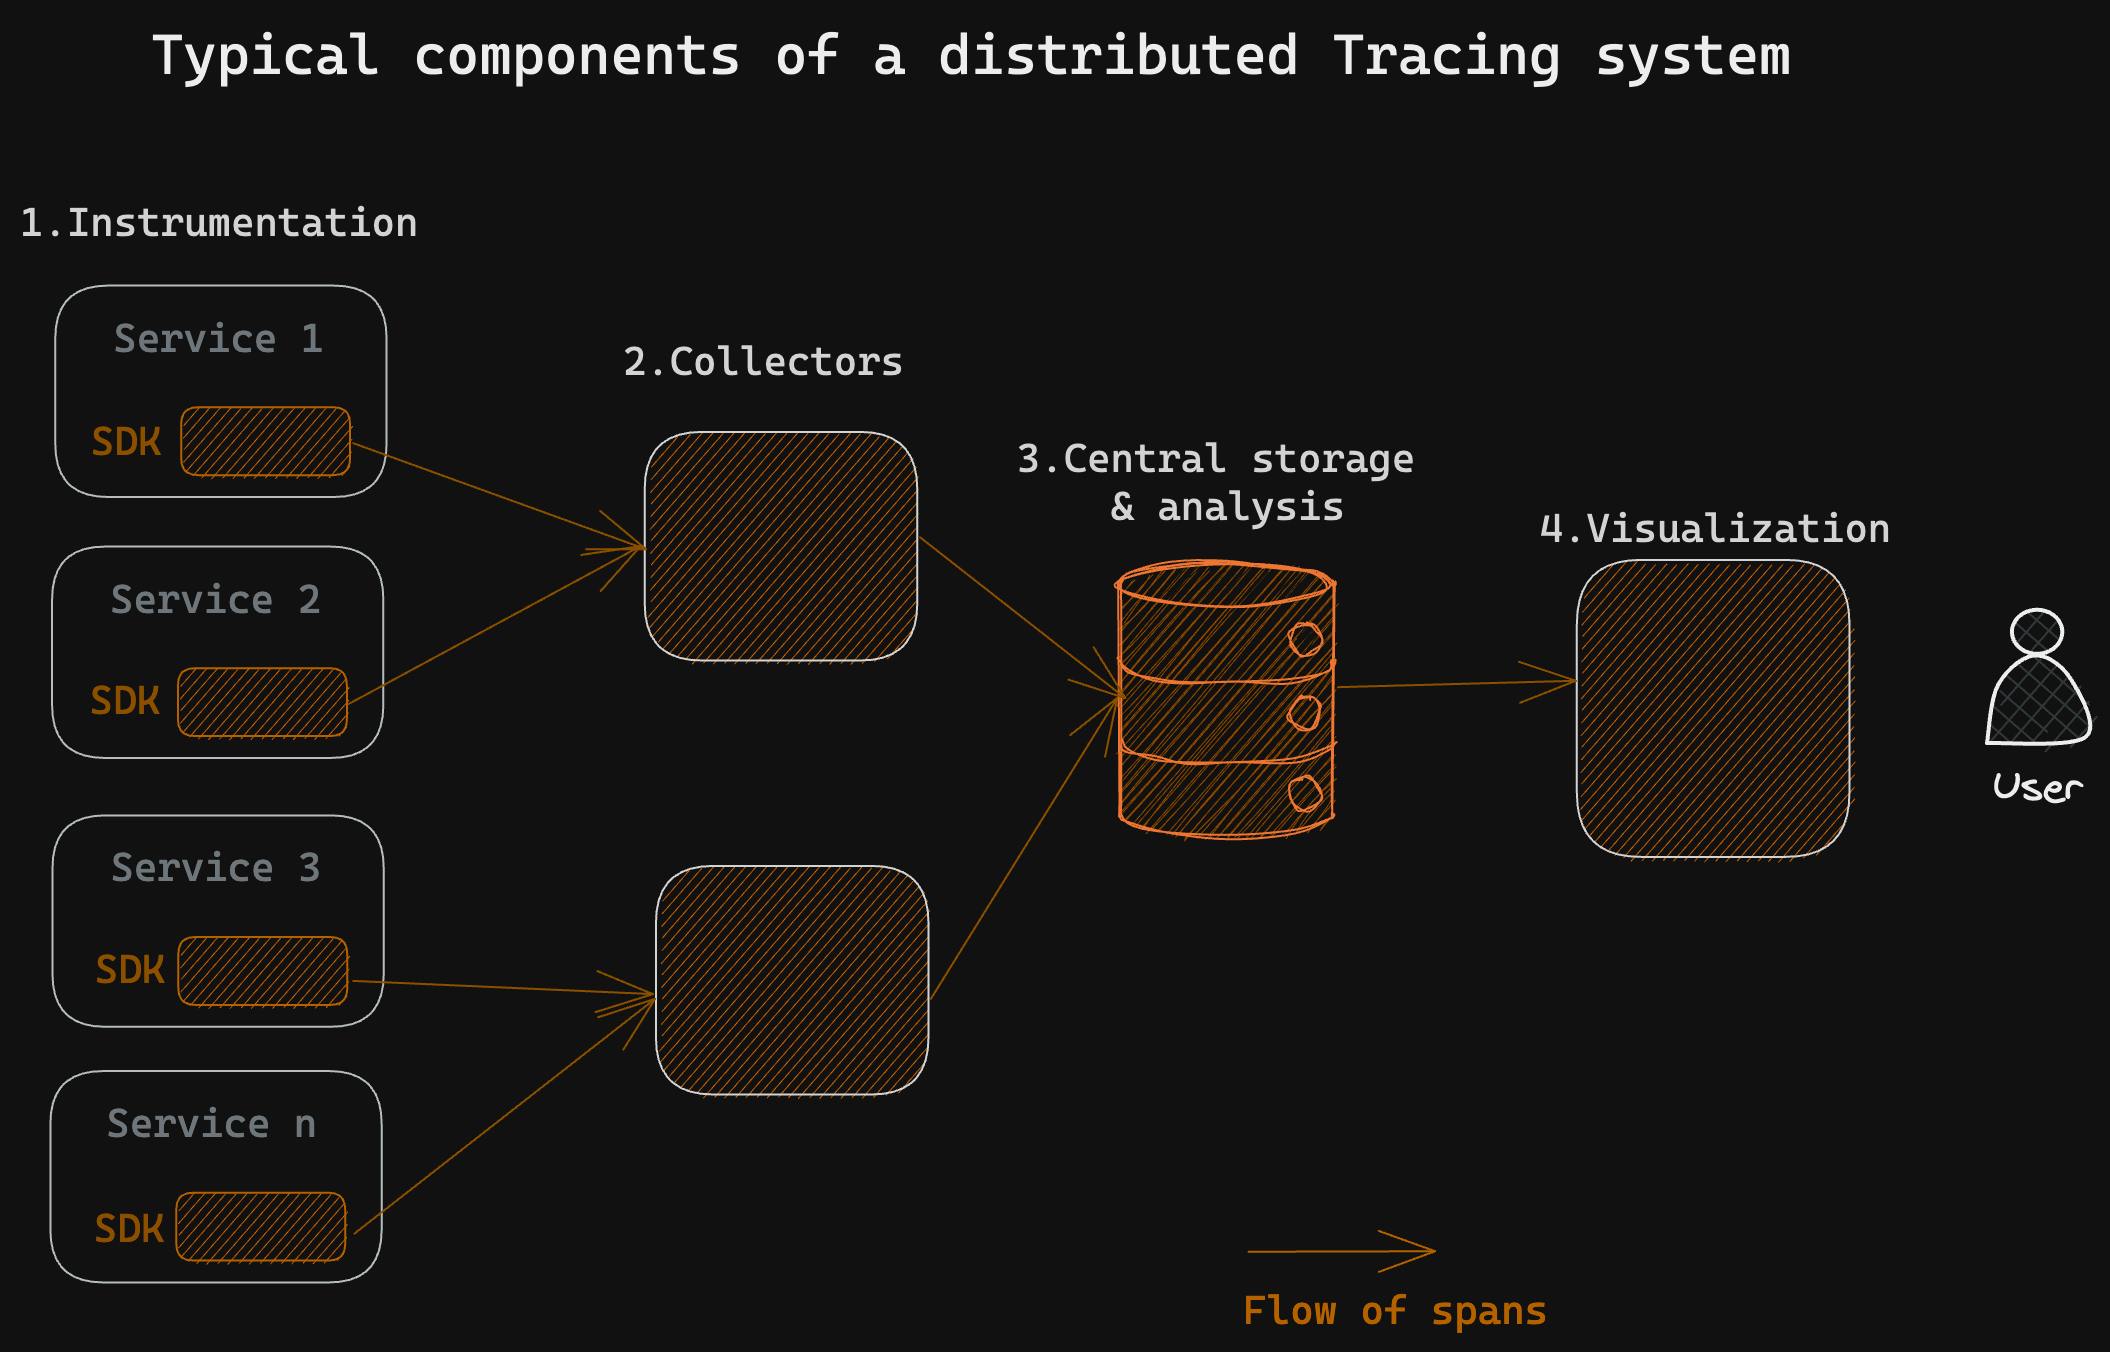
To implement any distributed tracing system, we install 4 distinct components -
Instrumentation library
Collector (pre-processor)
Storage back-end
Visualization layer
Today, there are several options available for each of these components - you could use one single platform that does all 4 above, or piece together your distributed tracing framework by using different solutions for different components.
Instrumentation library
This is the part that is integrated into each application or service. When an application executes, the instrumentation library ensures that traceIDs are added into each request, or that trace context (trace ID) is propagated into the next span. The library sends this data to a collector.
Collector
The collector is an intermediary between the instrumentation library and the storage back-end. It gathers traces, processes them (e.g., aggregating spans, sampling), and prepares them for storage.
Storage back-end
The storage back-end persists and indexes trace data. It typically uses a distributed storage system capable of handling large volumes of data and allows for efficient querying and retrieval.
Visualization Layer
This is the user interface of the distributed tracing system. It allows developers and operators to interact with trace data. This layer provides tools for querying, searching, and filtering trace data based on various criteria. It presents the trace data in a visually meaningful way, often as a trace graph or timeline, allowing users to analyze the sequence of events and identify bottlenecks or issues.
Implementing distributed tracing systems is complex
While there are several benefits, implementing distributed tracing systems (especially well), is not yet an easy, "solved" task. It requires that the implementing team take several decisions, and those decisions meaningfully impact the amount of value the rest of the engineering team gets from tracing.It’s not uncommon for companies to implement distributed tracing and pay half a million dollars annually, only to have the average developer use it only twice a year. See below for some best practices in how to implement tracing well.
Best practices for Distributed Tracing
1. Pick OTel for instrumentation
There are several popular open-source tracing frameworks such as OpenTelemetry, Jaeger and Zipkin. Today in 2023, OTel has become somewhat of an obvious choice, for the following reasons-
Wide coverage - OTel has instrumentation libraries and SDKs for different programming languages and frameworks and has broad coverage by now. See here for what OTel supports.
Is vendor-neutral - By now, most vendors support OTel instrumentation. So you could instrument with OTel and push the data to any vendor of your choice. You'd have vendor interoperability and portability over time (should you choose to change vendors). This is a list of observability vendors that natively support OTel data and here's a registry of libraries and plugins for connecting OTel with other vendors.
Maturity and stability - OTel has been maturing for several years, with wide community support. It is now the 2nd largest project in the CNCF ecosystem in terms of contributors, next only to Kubernetes itself. The strong community ensures it continues to evolve and add support to new technologies rapidly
2. Leverage automatic instrumentation where possible
OpenTelemetry provides two ways to instrument code into applications and components - manual instrumentation and automation instrumentation. If you're on Kubernetes and if most of your services are on Java, NodeJS or Python, leverage automatic instrumentation extensively as it reduces implementation effort.
Manual instrumentation
The OTel code has to be added to the application by the developer, so this requires a code change. Manual instrumentation allows for more customization in terms of spans and traces. Most languages are covered for manual instrumentation - C++, .NET, Go, Java, Python, etc. Refer here for the latest list.
Automatic instrumentation
This is a way to instrument applications/ services without making code changes, or having to recompile the application. An intelligent agent gets attached to an application, reads its activity, and extracts the traces. This is possible if you are on Kubernetes. OTel today supports automatic instrumentation for Java, NodeJS, Python, etc (refer here for the latest list). Customization of spans and traces is limited with automatic instrumentation (vs. manual instrumentation), but is sufficient for most use-cases.
3. Start with critical paths and expand from there
It is impractical to instrument every service/ component in large distributed systems in one go, so it is important to thoughtfully pick out which paths to instrument first and how to expand from there. Some guidelines/ principles to follow here -
Go outside-in/ Start close to the users
It is often best to begin from the outside and move inward. This means starting at the points where a request enters your application - incoming requests from users or external clients. By starting at the entry points, it is easier to get a holistic view of how requests flow through the system.
Pick the most critical paths in the system and instrument them first
The general guideline is to identify the most important request paths in your system - these may be the ones that are most frequently accessed or have the most significant impact on overall application performance monitoring well. Start by instrumenting these critical paths first so you can demonstrate value to the overall organization, and then expand from there.
Always instrument request paths end-to-end so a trace doesn’t break
Whatever paths you choose, ensure that the path is instrumented end-to-end - which means each service and component in the request path is instrumented to propagate the context (TraceID) and generate spans as required. Any gaps result in incomplete or broken traces, which negate the effort invested to instrument upstream services.
4. Be intentional about sampling
In 99% of the cases, companies want to sample their traces. This is because if you store every single trace, you might be storing and managing massive amount of data.
Let's take an example. Assume each span is 500 bytes (including tagging and logging). If your application is serving 2000 requests per second and has 20 different services, it ends up generating 20MB of data every second, or 72 GB per hour, or 1 TB each day, for a simple 20-service set up.
This is why most companies end up storing a sample of the distributed traces. It is important to select the right sampling strategy so you still get visibility into the things you care about, while also having control over costs.
Broadly, there are two categories of sampling-
Upfront/ Head-based sampling
This is a simple way to decide which spans to keep before any spans have been generated for a given request. This is called head-based sampling, as the decision is made at the beginning or “head” of the request. In some cases, it is referred to as unbiased sampling when sampling decisions are made without even looking at the request. Within head-based sampling, there are several mechanisms commonly in use, like below.
Probabilistic or fixed rate sampling: Randomly selecting a subset of traces to keep based on a fixed sampling rate - say 1%
Rate-Limiting Sampling: Setting a fixed limit on the number of requests to be traced per unit of time. For instance, if the rate limit is set to 100 requests per minute, only the first 100 requests in that minute will be traced.
Priority-Based Sampling: Priority-based sampling assigns different priorities to requests, and the sampling rate is adjusted accordingly. Requests with higher priority (e.g., critical transactions) have a higher rate of sampling and lower priority requests have a lower rate.
Tail-based Sampling
Tail sampling is where the decision to sample takes place based on the responses within the trace - e.g., high latency, errors. This method ensures that "interesting" requests are traced, even when overall sampling rates are low. However tail-based sampling is much harder to implement (vs other simpler methods), as one would have to store in buffer all traces until the response comes back. This guide covers tail-based sampling in some depth.
Most organizations typically resort to a simple head-based probabilistic sampling mechanism, with a rate of 1-3% sampling. See here for how to configure fixed rate sampling at OTel.
5. Be selective in implementing custom tracing
Distributed tracing is powerful in that it allows us to report custom tracing spans. Custom spans allow us to enrich distributed traces with additional, domain-specific information, making tracing data more meaningful.
It’s possible to capture and log error states as part of a span, or create child spans that further describe the functioning of a service. Effectively tagged spans can in turn significantly reduce the amount of logging statements required by your code.
In the context of tracing, breadth refers to the number of services or components being instrumented, while depth refers to the level of detail captured within each span. Striking the right balance between breadth and depth is crucial in implementing an effective tracing mechanism, while also controlling costs.
In general, it is a good idea to go as broad as possible, and to be selective in where you go deep.
6. Integrate tracing with your monitoring and logging systems
Make sure to connect tracing with existing monitoring and logging systems, to make it easier for developers to correlate across the three datasets while troubleshooting. Typically this is done through -
Log Injection: Inject trace IDs/ span IDs directly into logs using log frameworks or libraries. This way each log message has a traceID that can be used to easily query specific logs.
Metrics Tagging: Trace-related tags or labels can be included when recording metrics. These tags can be traceIDs or span names or other trace-specific metadata. This enables developers to filter and aggregate metrics around tracing data and makes it easier to understand distributed systems.
Protocols like OpenTelemetry already allow you to do this easily.
6. Pick a modern trace visualization front-end
There's meaningful difference across solutions in terms of the front end. After collecting tracing data, you need to be able to visualise it. A good tracing visualisation will allow you to see the flow of tracing requests through a system and identify performance bottlenecks.
However, all tracing solutions do not provide an intuitive and user-friendly way to visualize and analyze this data directly. Some tools excel at collection and storage of tracing data but have basic visualization (e.g., Jaeger, Zipkin, AWS XRay), while others are more focused on providing insights from tracing data and as a result have invested in more sophisticated visualization and analytics (e.g., Honeycomb, Lighstep, Helios).
Good visualization tools should offer out-of-the-box dashboards that automatically give you service dependency maps, have Gantt and waterfall trace visualizations, and allow for detailed querying and filtering of traces. This article is a well-rounded PoV on visualization in distributed tracing.
7. Explore next-generation tools that combine AI and tracing
With OTel maturing rapidly, instrumentation has become pretty standardized. Similarly, storage and querying have also become broadly commoditized across the observability industry over the last few years. Today there is some differentiation in the visualization and analytics layer, although even that is not meaningful.
There is an emerging class of solutions which use AI on distributed tracing data to generate inferences on causes of issues. These solutions also have the most modern tracing stack and make implementation and management dramatically simpler. For example, solutions like ZeroK allow you to do the following -
Install distributed tracing across all your components in one go without any code change - all services, DBs and queues are covered right away using OTel and eBPF
They eliminate need for sampling- they process 100% of traces and use AI to automatically identify anomalous/ "interesting" ones to store (e.g., error traces, high-latency traces)
Append the anomalous traces with additional context (e.g., logs) to aid debugging as required
Apply LLMs to these traces to automatically identify likely causes of your production issues
ZeroK is just one of the early solutions in this space, and there are likely to be several others that will emerge over the next few years. While this is an early category and these players are not mature yet, it's a good idea to keep an eye on these solutions.
8. Invest in developer onboarding!
This is an often overlooked but a critical factor that will drives the success of distributed tracing in your organization. Remember that distributed tracing is complex, and it is difficult for new developers to get up to speed on how to use it effectively. It is not at all uncommon for companies to have just a handful of power users are using the tracing platform, and that too a couple of times a quarter.
Developers need to be taught how to interpret trace data, understand the relationships between different microservices, and troubleshoot problems using distributed tracing tools. They must be guided on best practices such as consistent naming conventions, proper instrumentation, and understanding trace context propagation. Planning developer onboarding for distributed tracing is a strategic investment. It not only accelerates the integration of tracing within the system but fosters a culture where developers are active participants in the continuous improvement of system visibility, reliability, and performance.
Conclusion
We looked at distributed tracing best practices, and what you can do to make the journey easier. Distributed tracing is no longer a novelty; it has evolved into a crucial part of the observability stack. For an exploration of where distributed tracing is headed next, read this: Distributed Tracing: Past, Present, Future. With rapid advances in AI, how we do Observability itself is expected to undergo a sea change, and we can expect several exciting developments. Stay tuned to this space for updates!